


JK Lakshmi Cement — Driving Innovation and Transformation With Dataiku
Learn how JK Lakshmi's data team uses Dataiku to improve and save time on reports, and make operational tasks more efficient.
Learn More
improvement on forecast runtime
accuracy on a 52-week forecast
Founded in 1993, Action has grown in just 30 years to become Europe’s fastest growing non-food discount retailer. The company has spread its roots from the Dutch city of Enkhuizen, where it began, to 11 countries and over 2,300 stores across the continent.
With substantial growth comes a substantial inflow of data. Each of the company’s stores in The Netherlands, Austria, Belgium, Germany, France, Luxembourg, Poland, the Czech Republic, Italy, Spain and Slovakia needs to track everything from consumption patterns, to product placement, to supply chain disruptions — all of which vary according to local, national, and international trends. It’s no wonder, then, that Action has recognized the importance of developing an AI-driven data and analytics operation to further their success.
We spoke with Randy de Heus, Manager of Business Insights & Data Analytics, and Dawid Kirsten, BI Consultant for Insights and Analytics to learn more about how Action’s Data Analytics team is building the right architecture and toolset to leverage the company’s data with greater efficiency. And we discussed how Capgemini, as advisor and system integration partner, and Dataiku, as technology partner, have helped them work collaboratively across their datasets to develop more accurate forecasting models with greater speed.
As de Heus explained, the Data Analytics team’s vision is to enable Action to make decisions based on data, rather than on intuition. This is essential for supporting the company’s ongoing growth with focus on opening stores in existing and new markets. What’s needed above all is the ability to reliably forecast demand and sales in new and existing markets. On this front, de Heus said, “if you look at the technical architecture, I think we’re able to support the company.”
But existing architecture is not the only consideration. In order for the relatively new team to stay ahead of demand, a new the reference architecture was built together with Capgemini. Now, Data Analytics is in the middle of a transition that includes not only technological but also cultural shifts across the company’s IT, business, and marketing units. Showing their colleagues how analytics can be applied to decision-making across a variety of domains, and consequently how analytics can be integrated into workflows and business operations across the board is one of the team’s priorities. In other words, they want to demonstrate that analytics is not just about troubleshooting the present, but planning for the future.
That’s our goal: to be able to support not only the questions [our colleagues] have now, but also two years from now.Randy de Heus Manager of Business Insights & Data Analytics, Action
That vision is already becoming a reality at Action. But how did the team get there? As Kirsten told us, the foundations of the current data operation at Action were laid a little under four years ago, with the implementation of a data lake where all of the company’s raw data could be pooled and stored. With all of this historical data in one place, the team could investigate trends and patterns not normally seen in traditional reporting.
But the ideal, of course, is not only to know what is and has been but also what will be — to predict sales, demand, and much else over the weeks and months to come. There’s a wider gap between the two than some might think; forecasting models built on massive datasets require the use of machine learning and AI, which is a cut above more foundational data science practices (like building a data lake). This is where Dataiku came in.
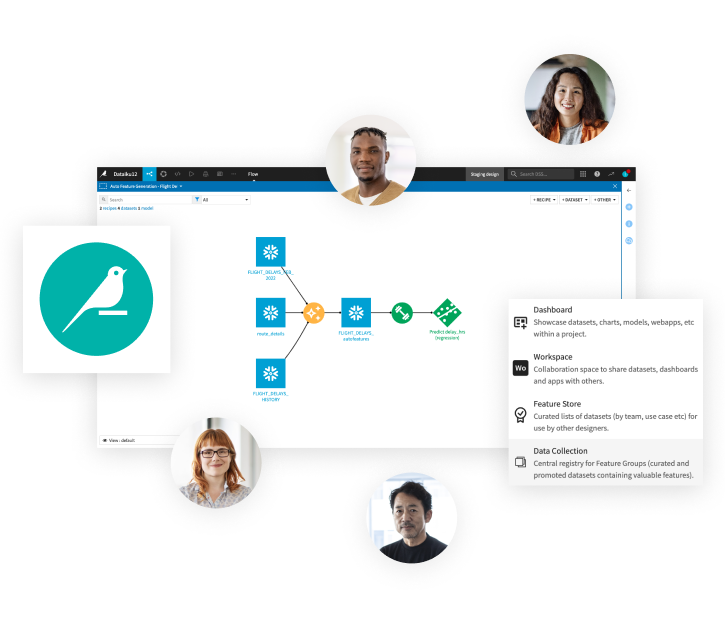
To get to model-building for the company, Kirsten and his team worked with Dataiku and Capgemini on a proof of concept to demonstrate the value of a robust and collaborative data platform. They wanted stakeholders from across the business to have visibility on how the data was being processed. So their first use case was maturing a proof of concept black box of code into a more easily explainable and understandable visual diagram of the data journey. “We had a really good experience taking our traditional data scientists on a visual discovery journey.”
Our journey with Dataiku has quickly gone from [it being] a third line of support to us having direct communications, support on use cases, and exposure to public use cases.Dawid Kirsten BI Consultant for Insights and Analytics, Action
That modest proof of concept became, in a short period of time, the team’s sales forecasting model. “When we initially did it, it was based on some R code on our server.” Then, with Dataiku, “we went through the process of linking it to live data, creating pipelines to move the data to the data lake, and also transferring that large block of code into visual recipe steps where possible, or else splitting the R code into buckets to be processed separately.”
The ability to manipulate data with visual recipes and split and sort analytics tasks has proved crucial for the team as the analytics operations have grown. Though it is primarily the data scientists who make use of the Dataiku platform directly, there are many functions within the Supply Chain Analytics team and other business units that benefit from access to the platform and its outputs, which flow directly into operational tasks.
For example, as Kirsten explained, the sales forecast model built with the platform “feeds through another tool that does the demand forecast, which feeds through another tool that does that replenishment forecast.” In short, “there are downstream systems and downstream users” who benefit from the work that data scientists are doing directly on the platform.
De Heus pointed out that this is an outcome entirely in keeping with industry trends. “What you see happening in the supply chain and commerce domain is that companies are investing in hiring data scientists. Because of this, analytics is becoming decentralized.” At Action, with each department making investments in data scientists and analysts, the core data team forms the hub of a hub-and-spoke data model. This move toward decentralization allows for the growth of a community of experts and free communication across the spokes of the organization.
Another way to understand the growth of the Data and Analytics team at Action is to look at how the team has addressed its most significant pain points over the past few years.
Like many nascent data operations, the Analytics team at Action started out by gathering, sorting, manipulating, and modeling data with Excel. While this worked for early-stage and small-scale projects, it quickly became a bottleneck to the speedy and efficient deployment of data analytics and models.
By developing the data lake, de Heus, Kirsten, and their colleagues were able to centralize the company’s vast inflow of data and regularize its access. The data lake became a reservoir out of which pipelines could then be built into the platforms on the team’s tech stack, including Dataiku.
As mentioned above, prior to working with Dataiku, Action was relying on Excel-built algorithms for their forecasting models. The process of deploying the sales forecasting model, which is run every week and realigned once a quarter, was over-complicated as a result. “They even needed a couple of laptops just to run the application,” de Heus explained.
The process was also, by consequence, relatively slow. It took several days to run the forecast each time, and hours more to realign it several times a year. With Dataiku, which allows the team to test, modify, and redeploy their models routinely and with precision, they brought the runtime of each forecast down to between 9 and 14 hours, and then further improved this to between 6 and 9 hours — a time savings of almost 900%.
I think that’s the added value of Dataiku: it’s not only the ability to build a solution or come up with an algorithm, but also the ability to deploy, maintain, and improve it.Randy de Heus Randy de Heus, Manager of Business Insights & Data Analytics, Action
As the team’s ability to build and deploy models increased, so too did the need for a reliable means of monitoring the processes from start to finish. “Of course, the first step is to create the algorithm,” de Heus said, “but the next step is to make sure that you can run it every day, multiple times a day.” An operation of that caliber has many stakeholders, from the data scientists building the models to the business analysts deriving insights from them. At every point of contact, the Data and Analytics team needed to have visibility on how the model is being built, changed, realigned, and used.
With Dataiku, Action has begun to see the benefits of a robust AI Governance system. The platform allows user-owners to view and control access to the team’s models and processes, from inception to deployment to feedback-aligned redeployment.
Solving each of the above pain points ultimately enables the Data team to drive value for the business. With easier cross-team collaboration on a single platform, a reliable data pipeline, and a clear view on existing processes, business units are empowered to operationalize the model-generated forecasts to make real-time decisions.
You want to give your business side the flexibility to start deploying a use case, something which is much easier to do with a tool like Dataiku.Randy de Heus Manager of Business Insights & Data Analytics, Action
It’s no small thing for your business team to have a reliable sales forecast. As Kirsten stressed, these are not easy to generate without the right tools. “We have gone from an Excel-based guesstimate of what the forecast should be to 88% accuracy on a 52-week forecast [with Dataiku],” he said.
Where Dataiku has made operationalization easier is in allowing both data scientists and line-of-business users to collaborate on the same data sets, thanks to the platform’s visual recipes. “If you use a visual recipe,” Kirsten said, “it’s much easier to explain to the business side what’s happening to the data. ‘This is what’s being filtered. This is how it looks.’ You can take them through every step of the path, giving them confidence in the results.”
Throughout our conversation, de Heus and Kirsten stressed that, despite the successes their team have already enjoyed, they are only just getting started. Looking ahead, they would like to continue building use cases that further prove the business value of data and analytics operations to the company’s line-of-business teams. Their first three use cases are already integral to business decisions at the company:
But they also help to promote the self-service data discovery that many business analysts have begun doing thanks to Dataiku. “We get involved when there are operational requirements, or if there is a specific request,” Kirsten said, but otherwise the team hopes that self-discovery can take off independently while the data scientists focus on playing with the data to find potential use cases, and on seeing whether they might integrate one of Dataiku’s out-of-the-box business solutions, like Market Basket Analysis, to support core business operations.
As they plan for the months and years ahead, de Heus and Kirsten aim to select the use cases to develop according to the principles that guide the growth of their team. “In the future, data science can be the difference between being successful and not,” de Heus said. “That, at the end, is what you’re trying to prove to the company. We’re currently doing well. But we always need to focus on how we can improve.”
Working with their colleagues at Action to adopt this data-driven mindset has been the bright thread for de Heus and Kirsten. As Action continues to grow and move into new markets, they hope to be a leading force behind the business’s strategic decisions. “It’s not easy to focus on the things that give you that extra 1% or 2%,” de Heus said, “but that’s what data can give you”: seemingly small differences with immense impacts in the long run.
Armed with Dataiku, Orange was able to start transitioning smaller BI projects to the business and work on machine learning use cases like call load detection and triage, a model that took less than a month for the team to build using Dataiku.
Read moreLearn how JK Lakshmi's data team uses Dataiku to improve and save time on reports, and make operational tasks more efficient.
Learn MoreSLB's People Analytics team uses Dataiku to better equip its talent management teams globally and improve talent retention.
Learn MoreJason Hardman, Head of People Data Center (PDC) Lab at Unilever, speaks with Jon Howells, Lead Data Scientist at Capgemini about how they've been able to harness data to better understand customer behavior.
Learn MoreThough the savings generated by the express shipping recommendation model will only fully materialize over time, the tool when globally implemented is estimated to reduce express shipment costs by 11-36%.
Learn More